How to catch pullbacks after falls
In the highly volatile cryptocurrency market, traders are looking for tools that allow them to quickly respond to changes. One such tool is a **price screener**. In this article, we will analyze a strategy that helps use such signals to find profitable entry points after falls.
Receiving a signal from the screener
The screener is configured to track significant price drops (for example, 5-10% over a short period). After receiving the message, it is necessary to analyze the asset using three key parameters:- Trading volume
- Open interest (for futures)
- General price trend
Goal: determine whether the fall is a temporary correction or the beginning of a downtrend.
Trading Volume Analysis
Volume shows the activity of market participants:- High volume during a decline is a sign of a strong seller. This may indicate a continuation of the downward movement.
- Low volume is a signal of weak selling pressure. A price rebound is possible.
Open Interest (OI) Assessment
Open Interest (relevant for futures markets) reflects the number of open positions:- OI growth during a decline is an increase in short positions. If the price starts to rise, a «short squeeze» (massive closing of shorts) is possible, which will push the price up.
- OI decline — traders are taking profits on shorts, which reduces the potential for a sharp pullback.
Trend Definition
Analysis of the general direction of the asset price movement:- Correction in an uptrend is a favorable opportunity to buy.
- Fall in a downtrend is a risk of further decline.
Additional tools
Moving averages (e.g. EMA 50/200),
Trend lines,
Support/resistance levels.
Search for pullback signals
After confirming the conditions (low volume, rising OI, uptrend), look for signs of a reversal:- Candlestick patterns: hammer, engulfing, pin bar
- RSI divergence: the price updates the minimum, but the indicator does not
- Breakthrough of local resistance
Opening a trade
- Entry point: defined after the appearance of rollback signals (for example, the candle closes above the previous maximum)
- Stop loss: set below the local minimum or key support level
- Take profit: defined at the level of previous maximums or using the risk/reward ratio of 1:3
Risk management
- Do not risk more than 2-5% of capital in one trade. Or better 0.5 — 1% (especially if you practice averaging)
- Combine the strategy with other indicators (MACD, Volume Profile)
- Consider macroeconomic events that can affect the market. Follow the news, updates in US monetary policy and speeches of important people
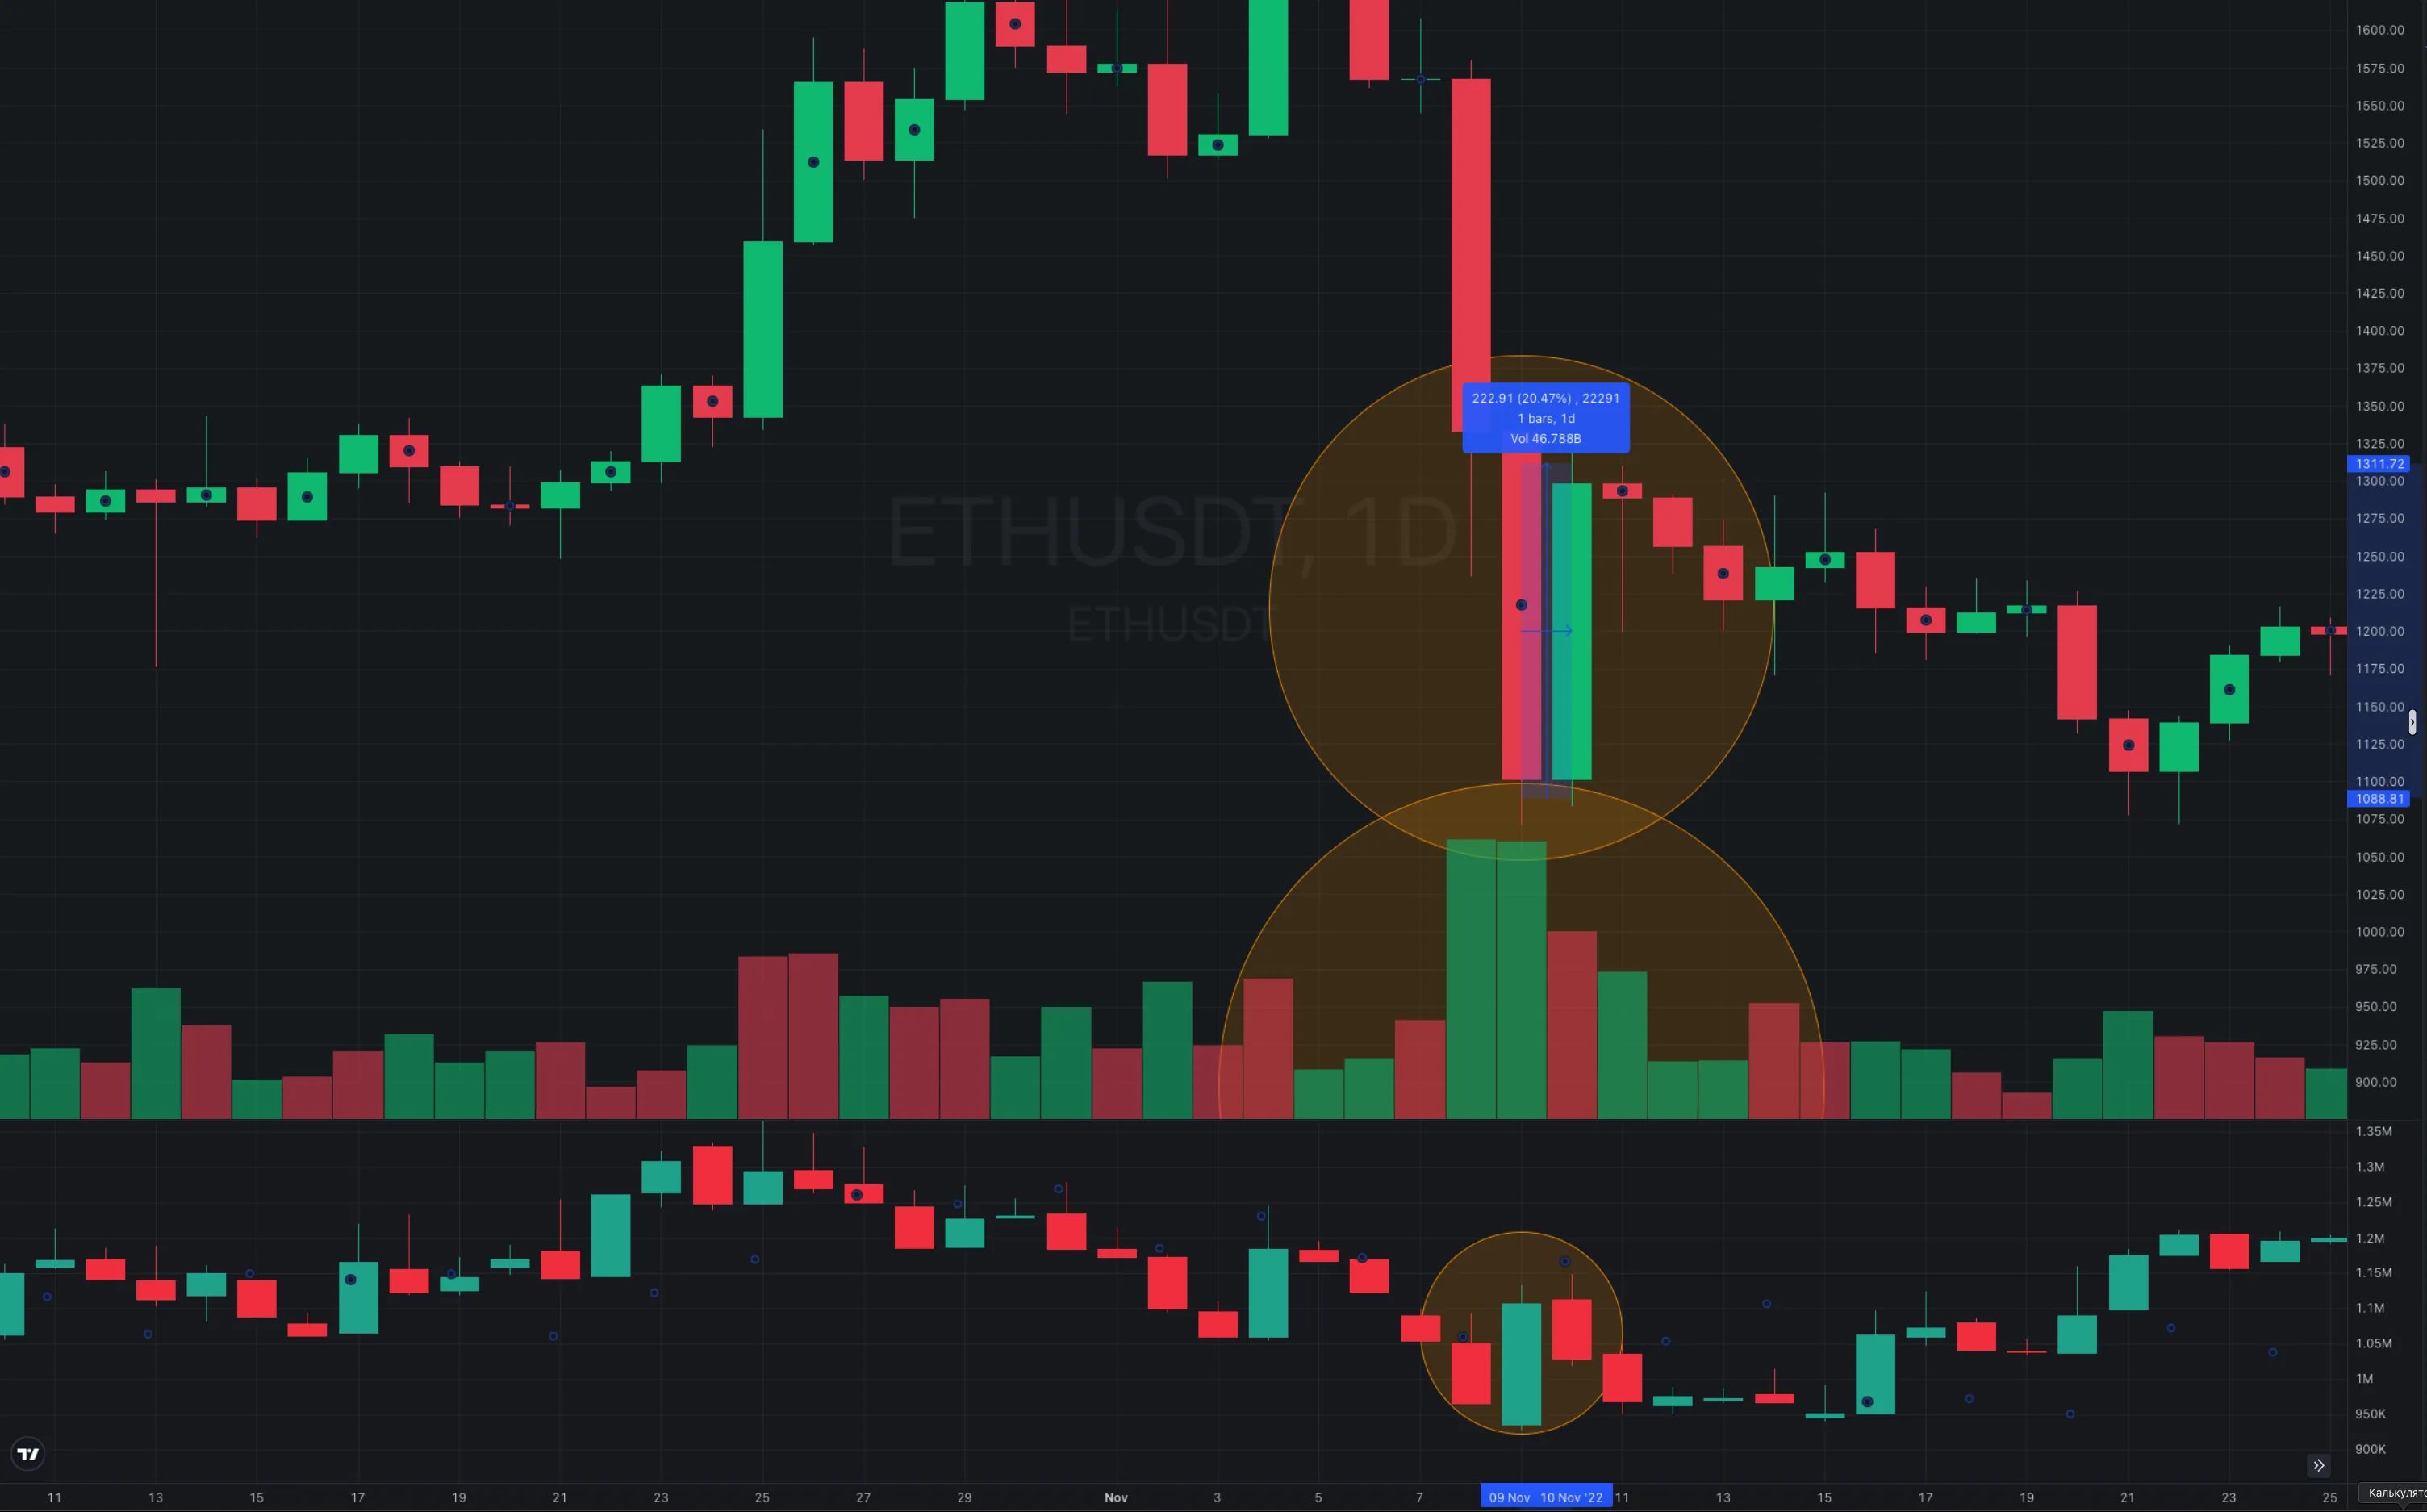
Example of using the strategy
Situation
Ethereum falls by 18% in a dayETH/USDT, Binance exchange, daily candles
Analysis
- Volume is above average
- Futures OI is up 15%
- General trend before the fall is upward
A strategy based on a price screener allows you to systematically approach trading after corrections. The key conditions for success are a strict selection of assets by volume, open interest and trend, as well as discipline in risk management. Remember: no tactic guarantees 100% results, so always test it on historical data before using it or on a demo account.
Other Knowledge Base Articles
Understanding the 'why' behind a signal is just as important as the signal itself. Our Knowledge Base breaks down strategies for working with each market parameter.
Basic theory
The main parameters of the asset
What is Open Interest?
What is Price?
What is Trade Volume?
What is Liquidity?
What is Funding Rate?
Spot vs Futures: Key Differences
Leverage and Liquidation
Market Sentiment
About Our Screeners
Open Interest Screener
Pump and Dump Screener
Volume Screener
Custom Screener
Funding Screener
Soon